
Inflation, the Ukraine war, and Covid-19 are all still hanging around. Does that sound like bullish market conditions? I think not.
The market does not like uncertainty and when there is uncertainty, volatility increases and markets head lower, which we have seen.
The S&P opened the year at 4771 and is now (at this writing) at 4500. The other indexes (Dow, NASDAQ, Russell) are down as well, and they should be based on the current conditions.
Let’s take it a bit further…
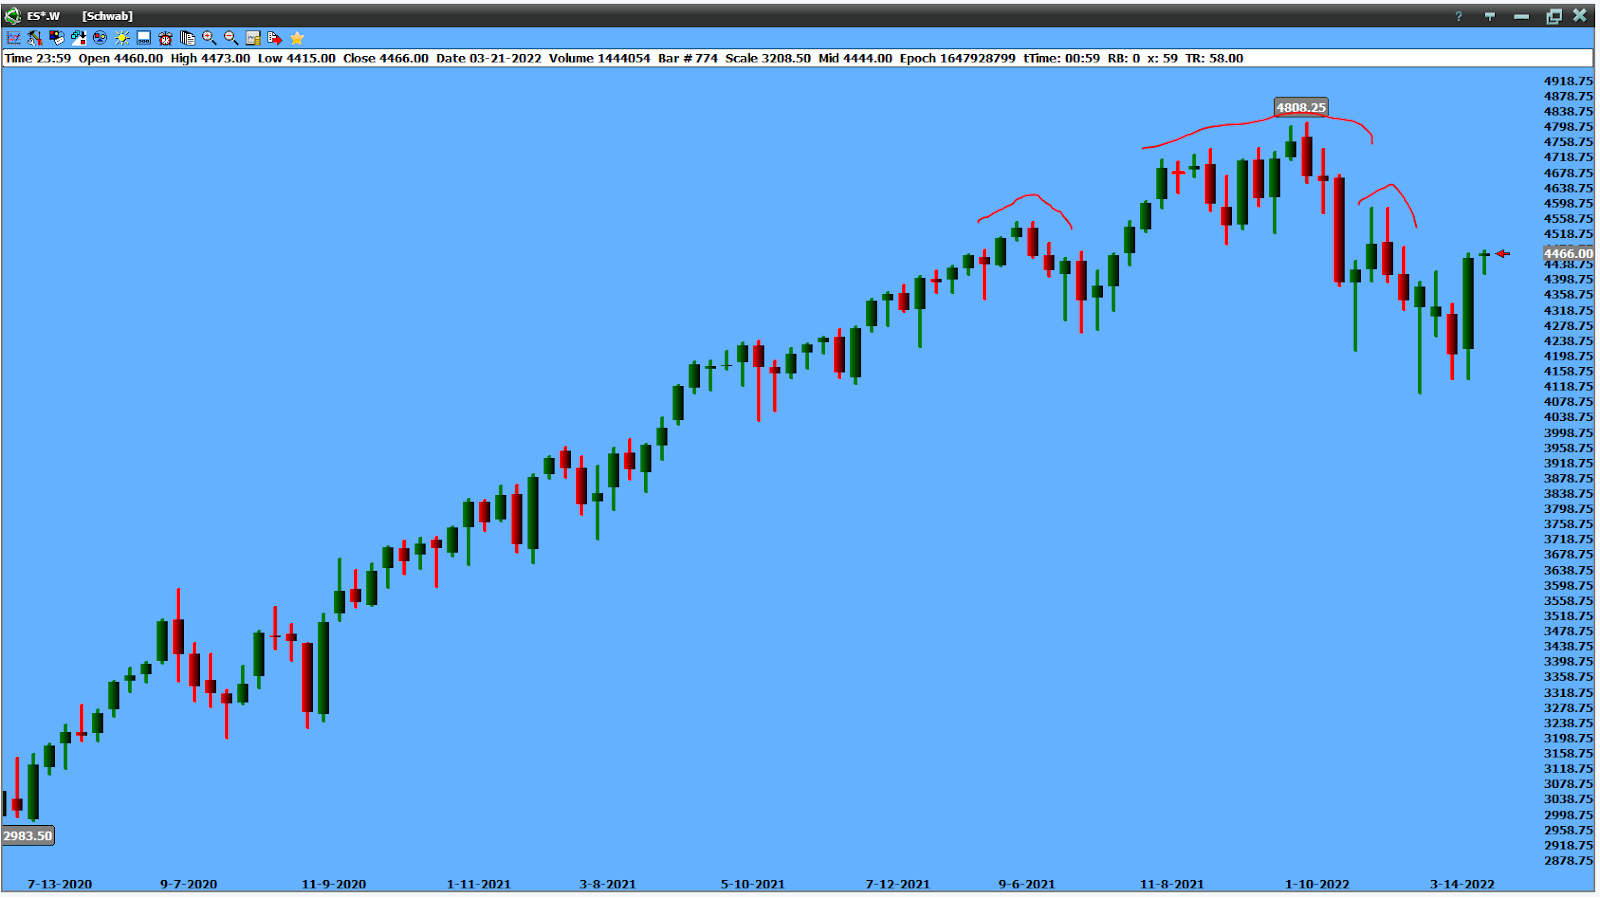
The chart above is a weekly S&P 500 futures chart. You can almost make out a head and shoulders pattern (red lines) on the chart. Not only that, it broke below the neckline.
I’m not going to go into the specifics of that chart pattern, but let’s just say it is not a bullish sign. So the bears have the upper hand, right?
Well, take a look at the chart below:
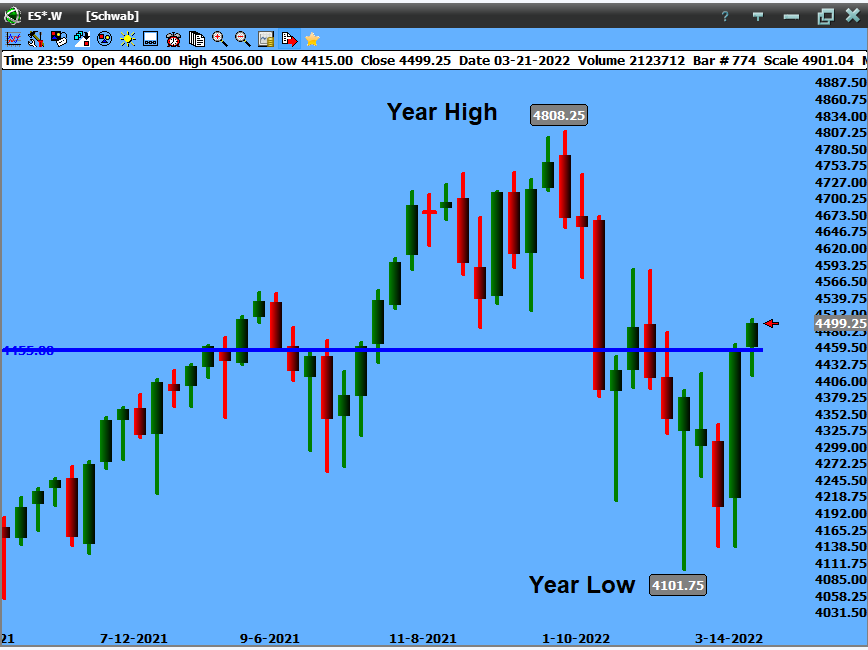
S&P 500 Weekly Chart
The horizontal blue line is at 4455 on the S&P. That is the midpoint of the year. If the market is so weak, then why is it trading in the upper half of its range?
This is what makes the market uncertain to traders.
Each big sell off is followed by nice rallies. And if you look at where the S&P was on March 16, when the Fed raised interest rates, the S&P has moved from 4250 to 4500. That’s not bad for everyone expecting it to sell off after rates were raised.
I still think the battle is on, and there are both bullish and bearish signs. This is a day traders’ market at this point, but only time will tell whether we go up or down.
Trade to Win,
Geoffrey Smith
P.S. Each morning I go through a similar look at the markets for my Trade of the Day service. I analyze the overall markets and also look at my favorite thing to trade, commodities.
You can learn more about the Trade of the Day service by clicking here.